Omnicell logo.

Scorecards

Role: Senior Product Designer

Tools: Figma, sketching

Methods: Data visualization, usability testing

Soft Skills: Building rapport with cross-functional teams

Work Overview

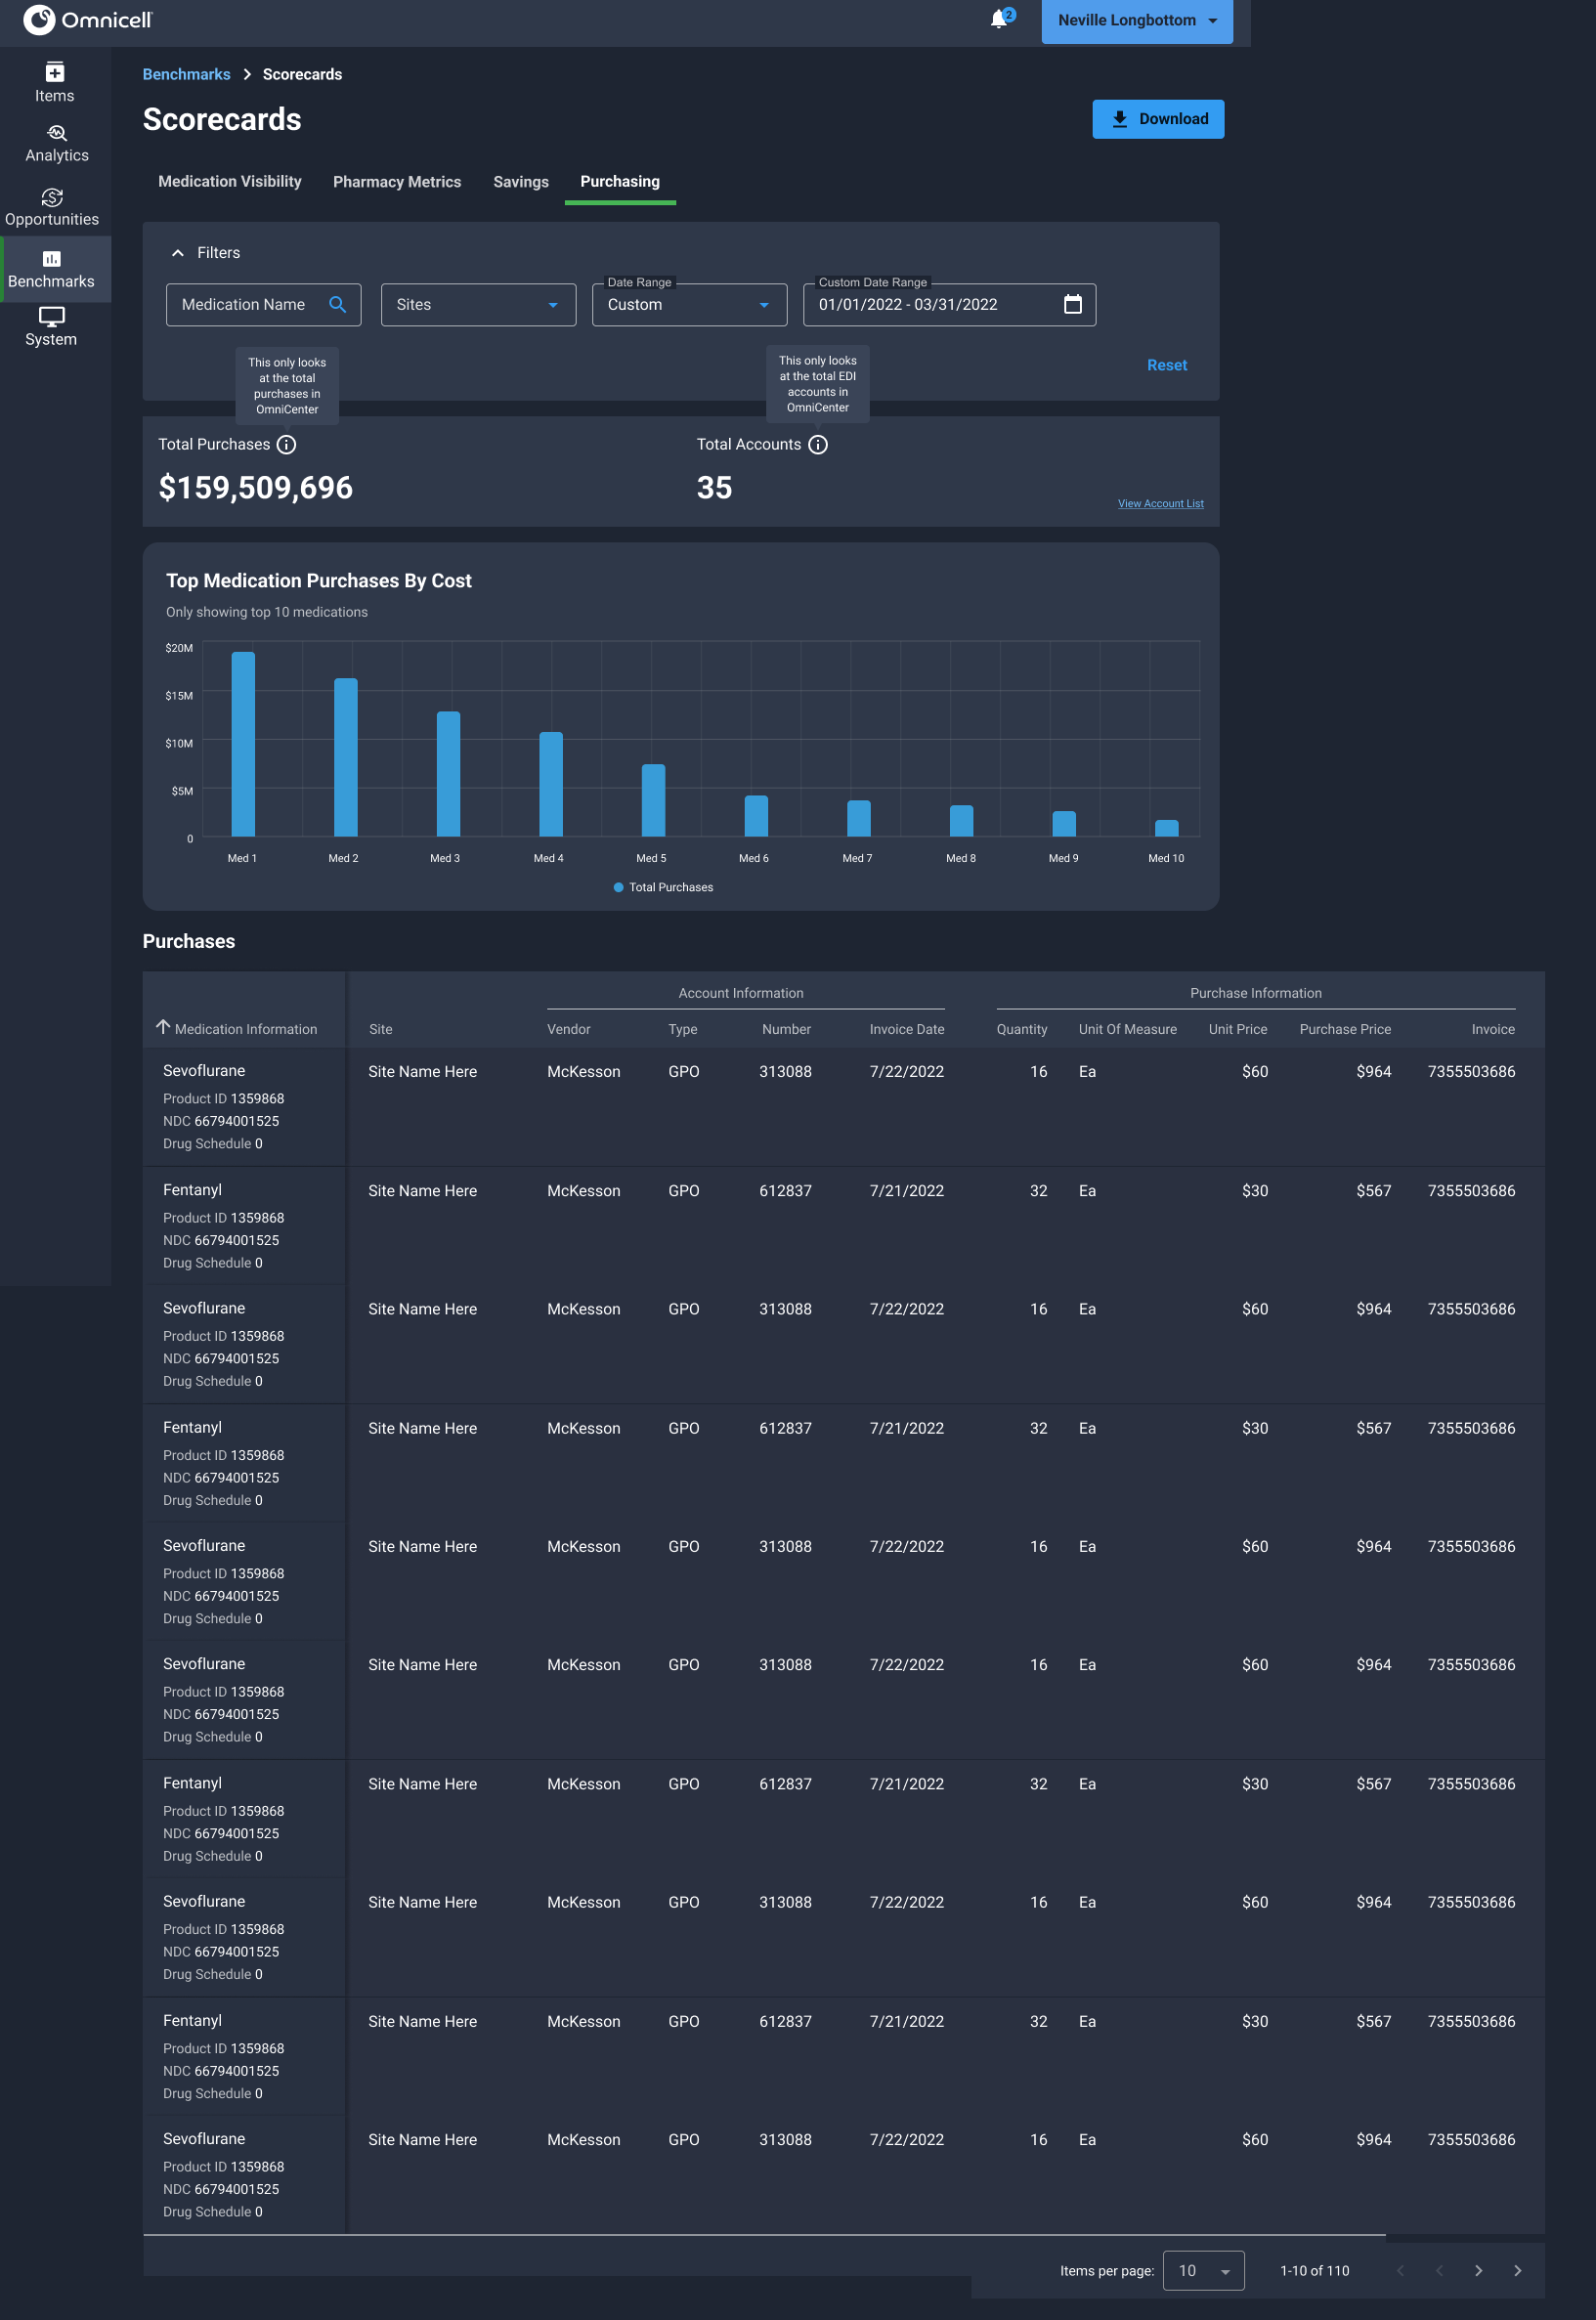
While I was working on Benchmarking at Omnicell, I also took on another project called Scorecards. Scorecards is another aspect of Inventory Optimization Services (IOS) that was in the same vertical as Benchmarking, but measures KPIs such as Total Valuation, Total Savings, and Total Purchases instead of Shortages or Overrides. The primary ask was to bring Scorecards up to date with the latest visuals within the design system, however it soon became apparent that some major changes besides updating to the latest visuals and design system patterns needed to be made.

I first started off by doing a heuristic analysis of Scorecards. Three violations immediately stood out to me:

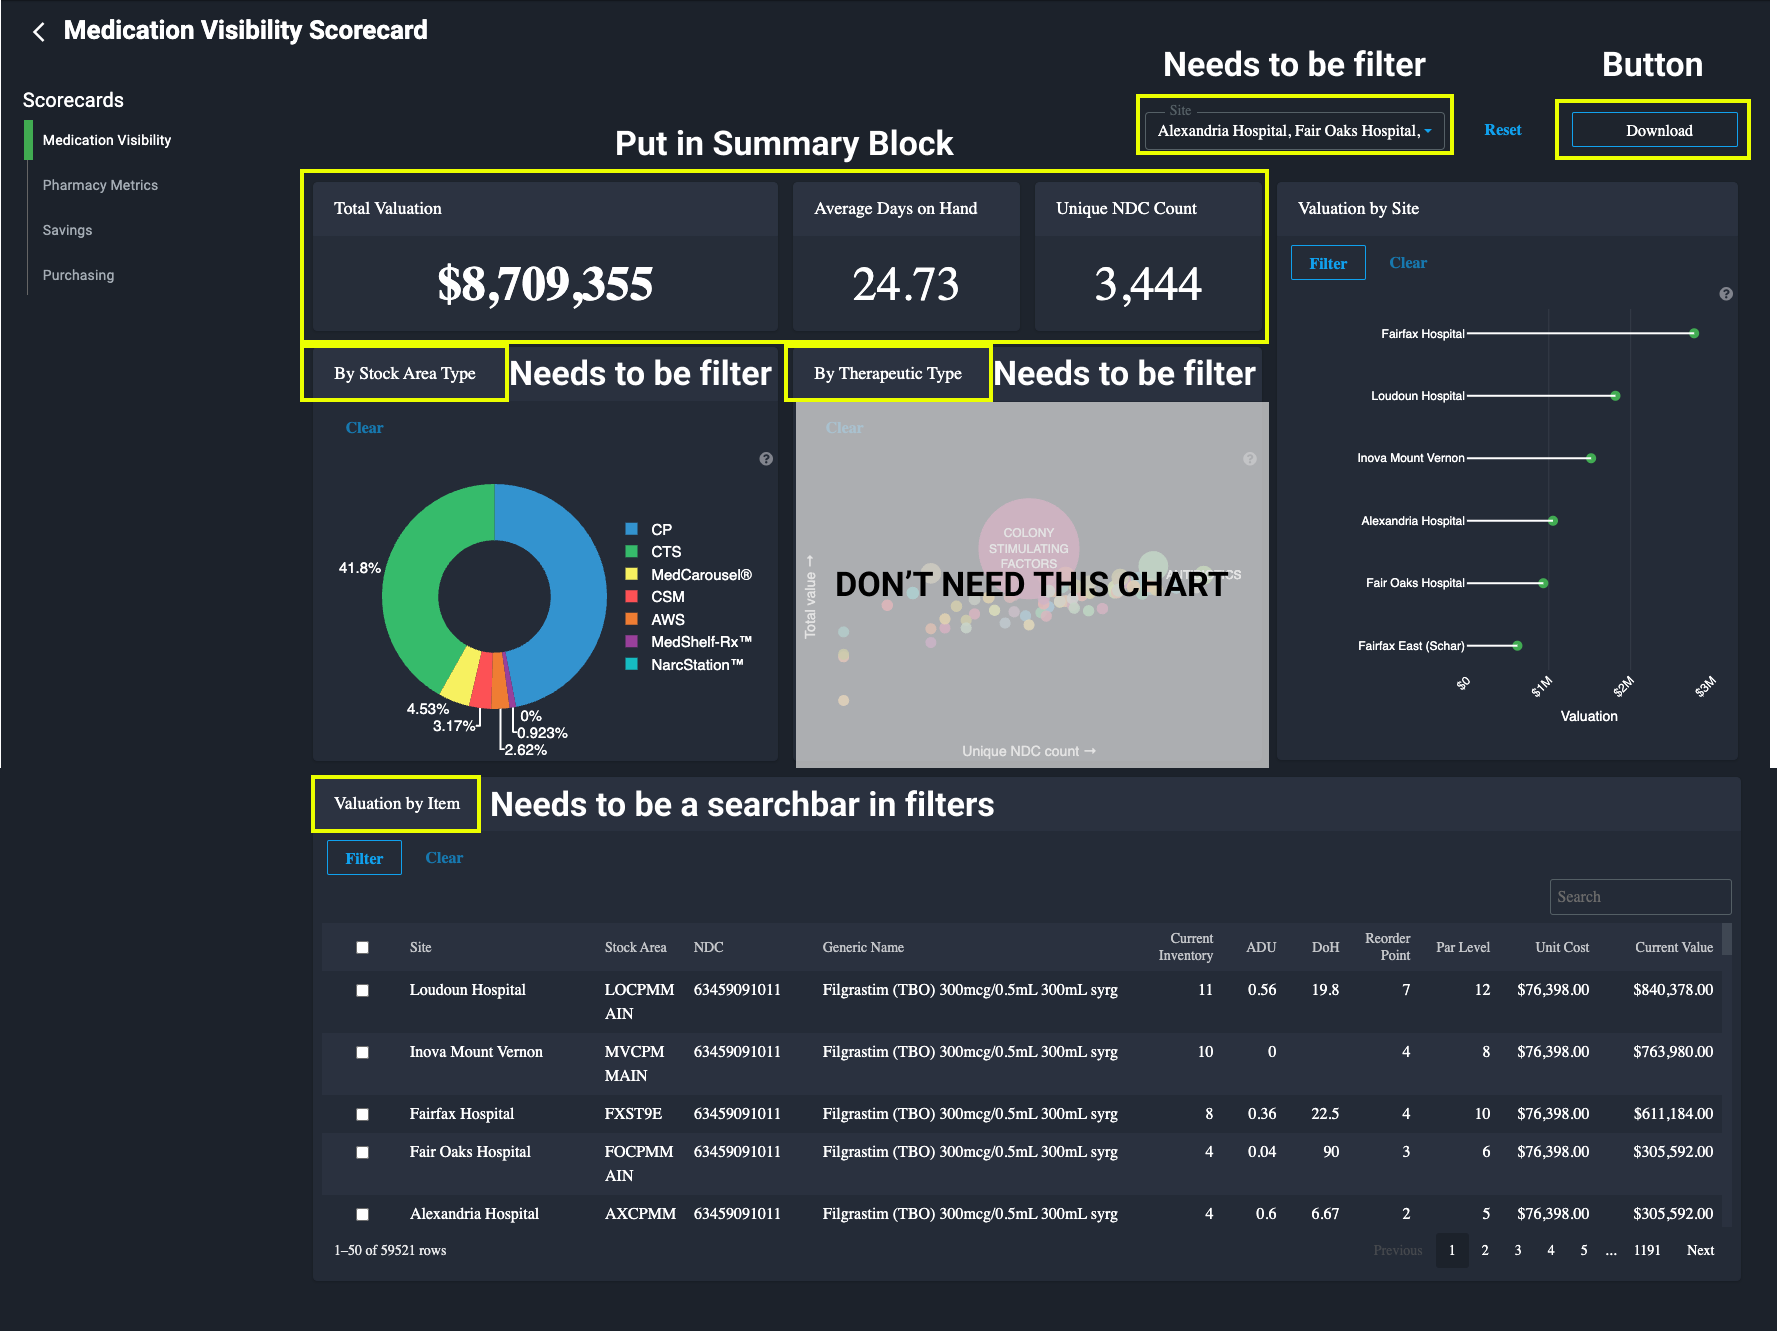
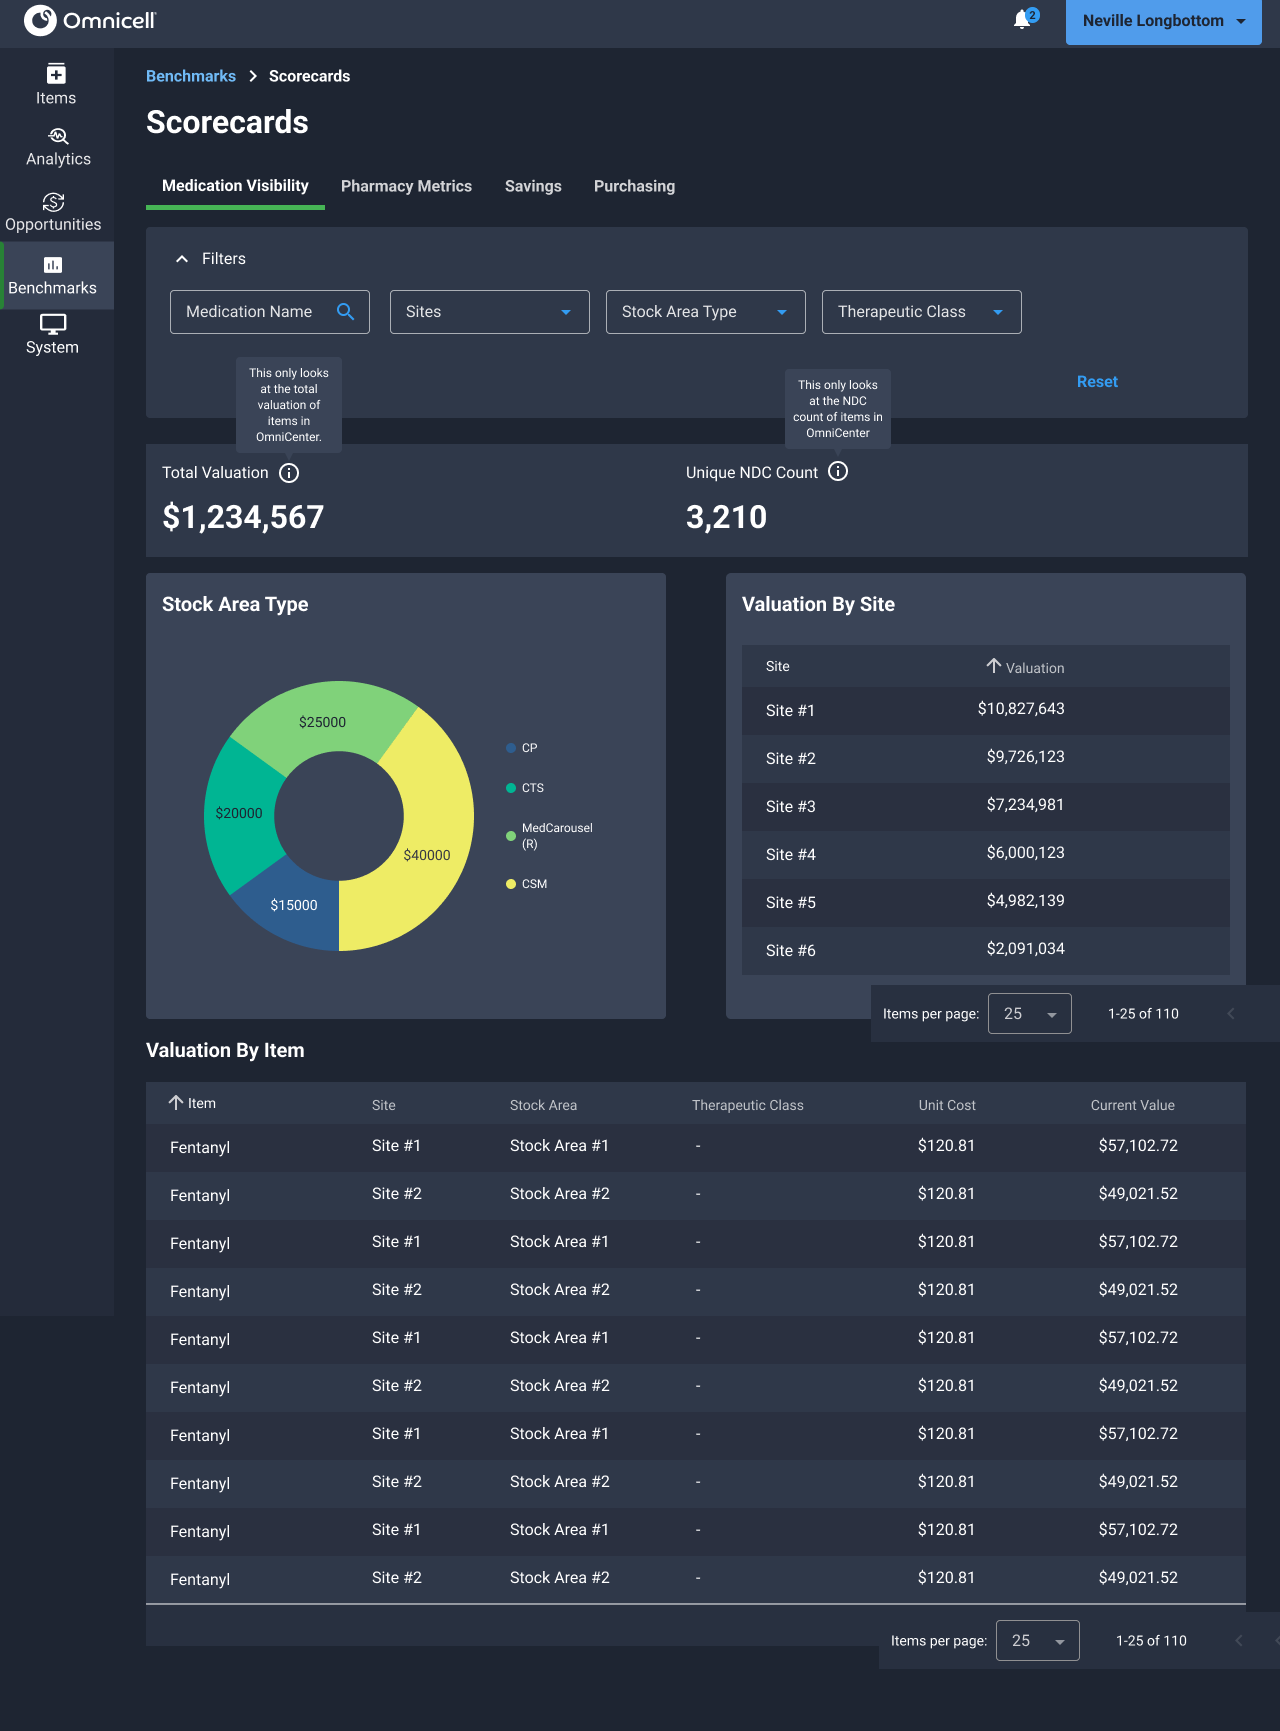
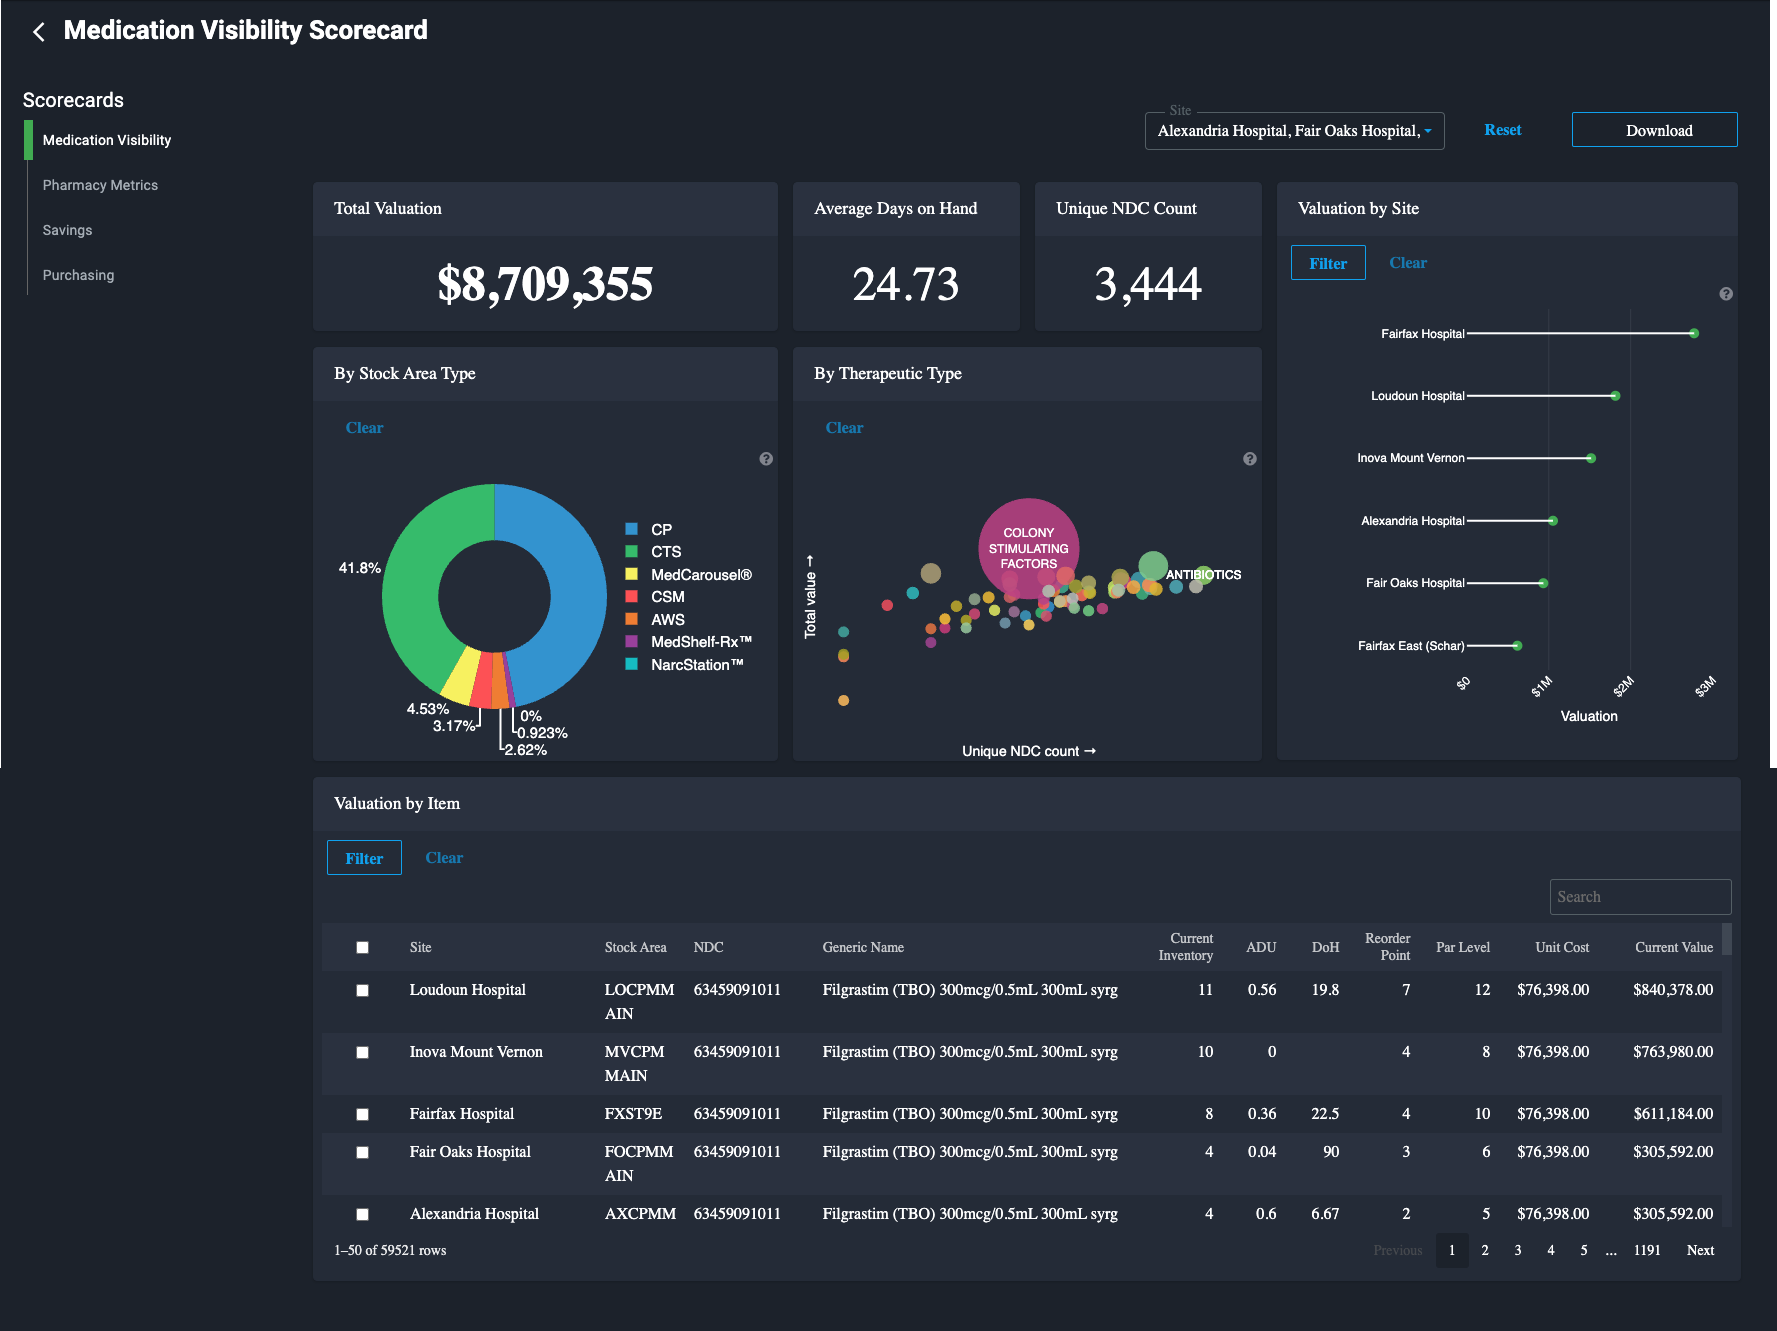
Medication visiblity scorecard example with dummy data.
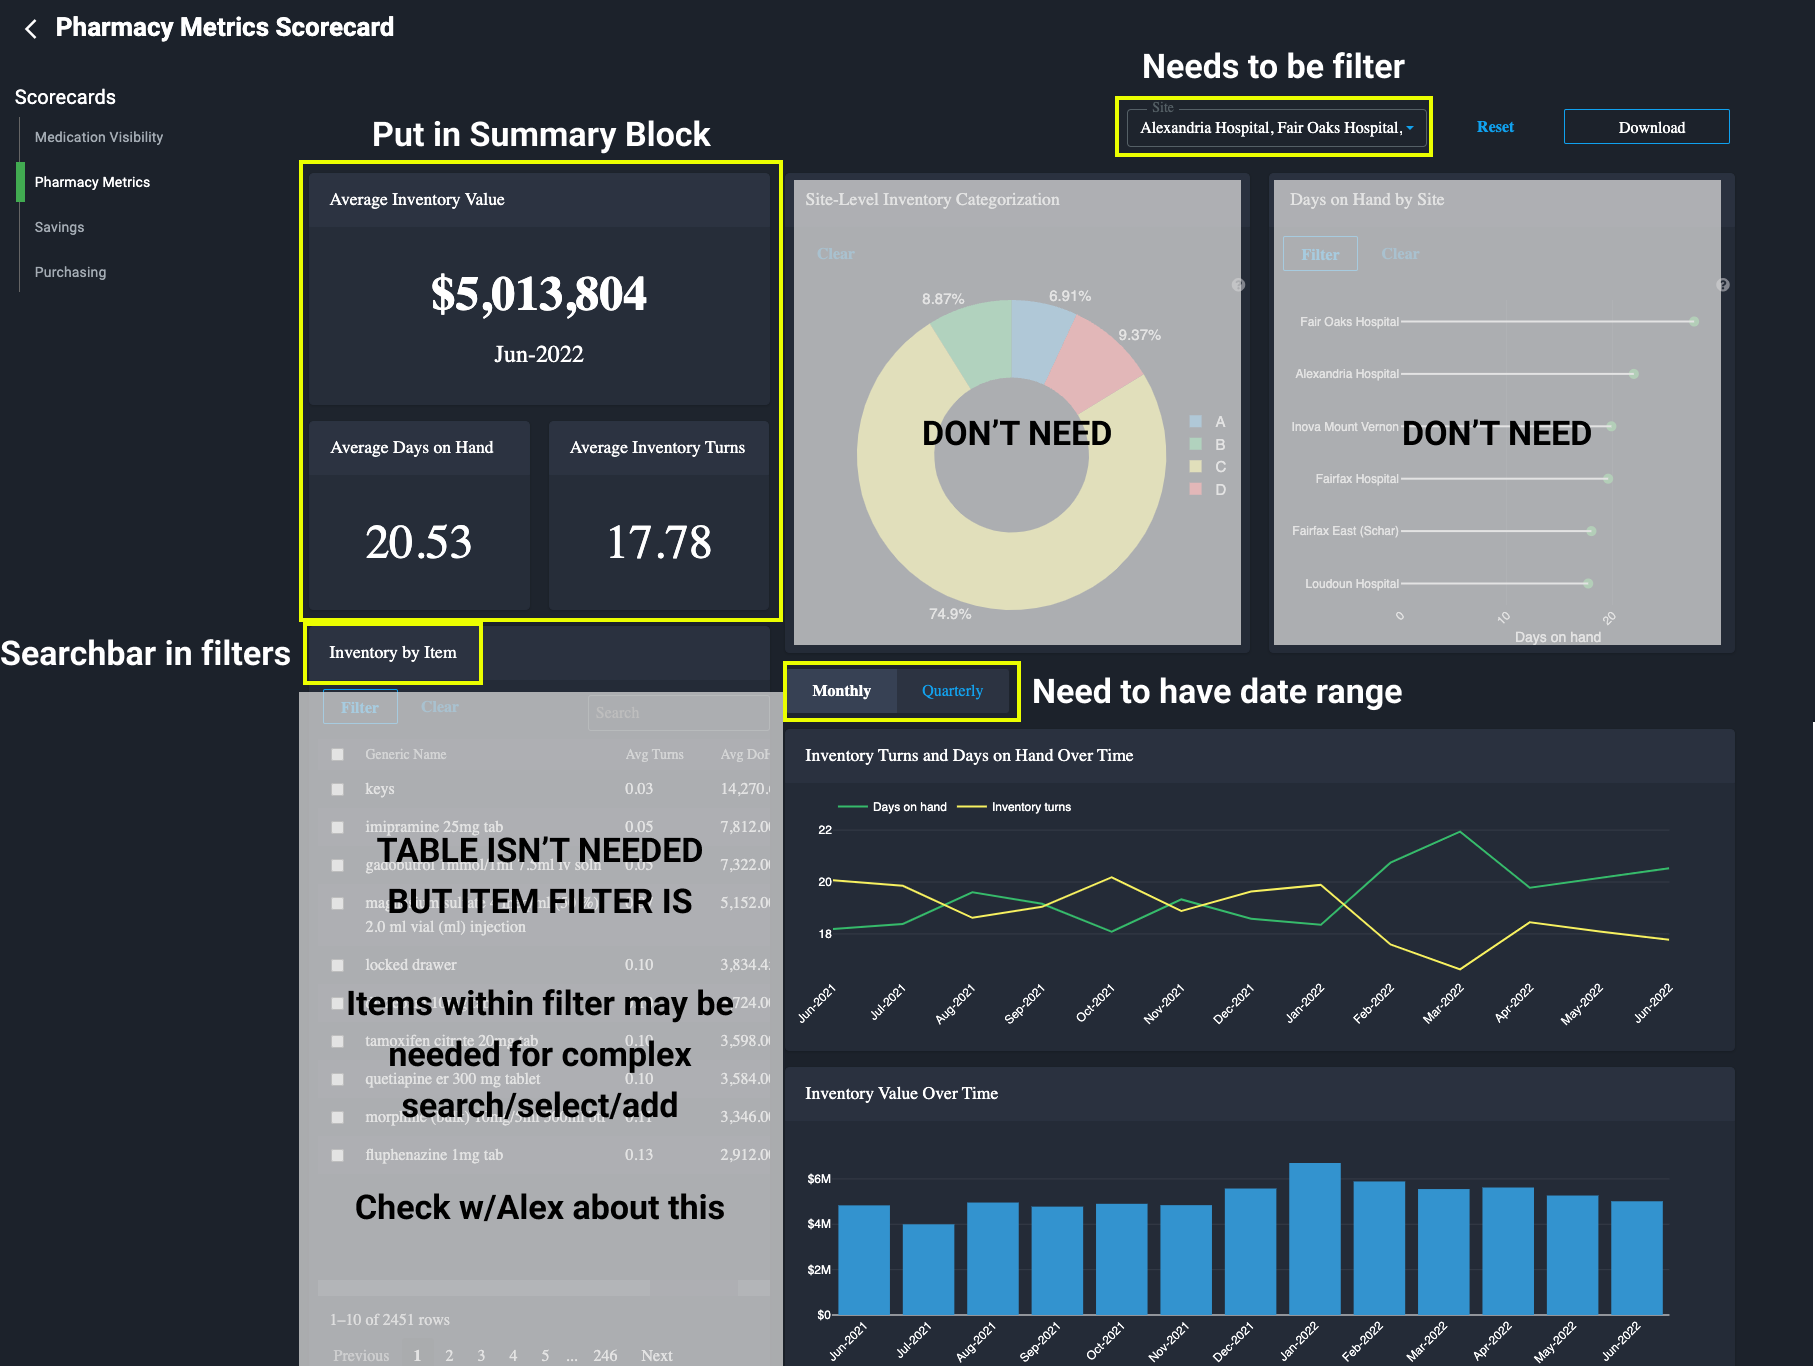
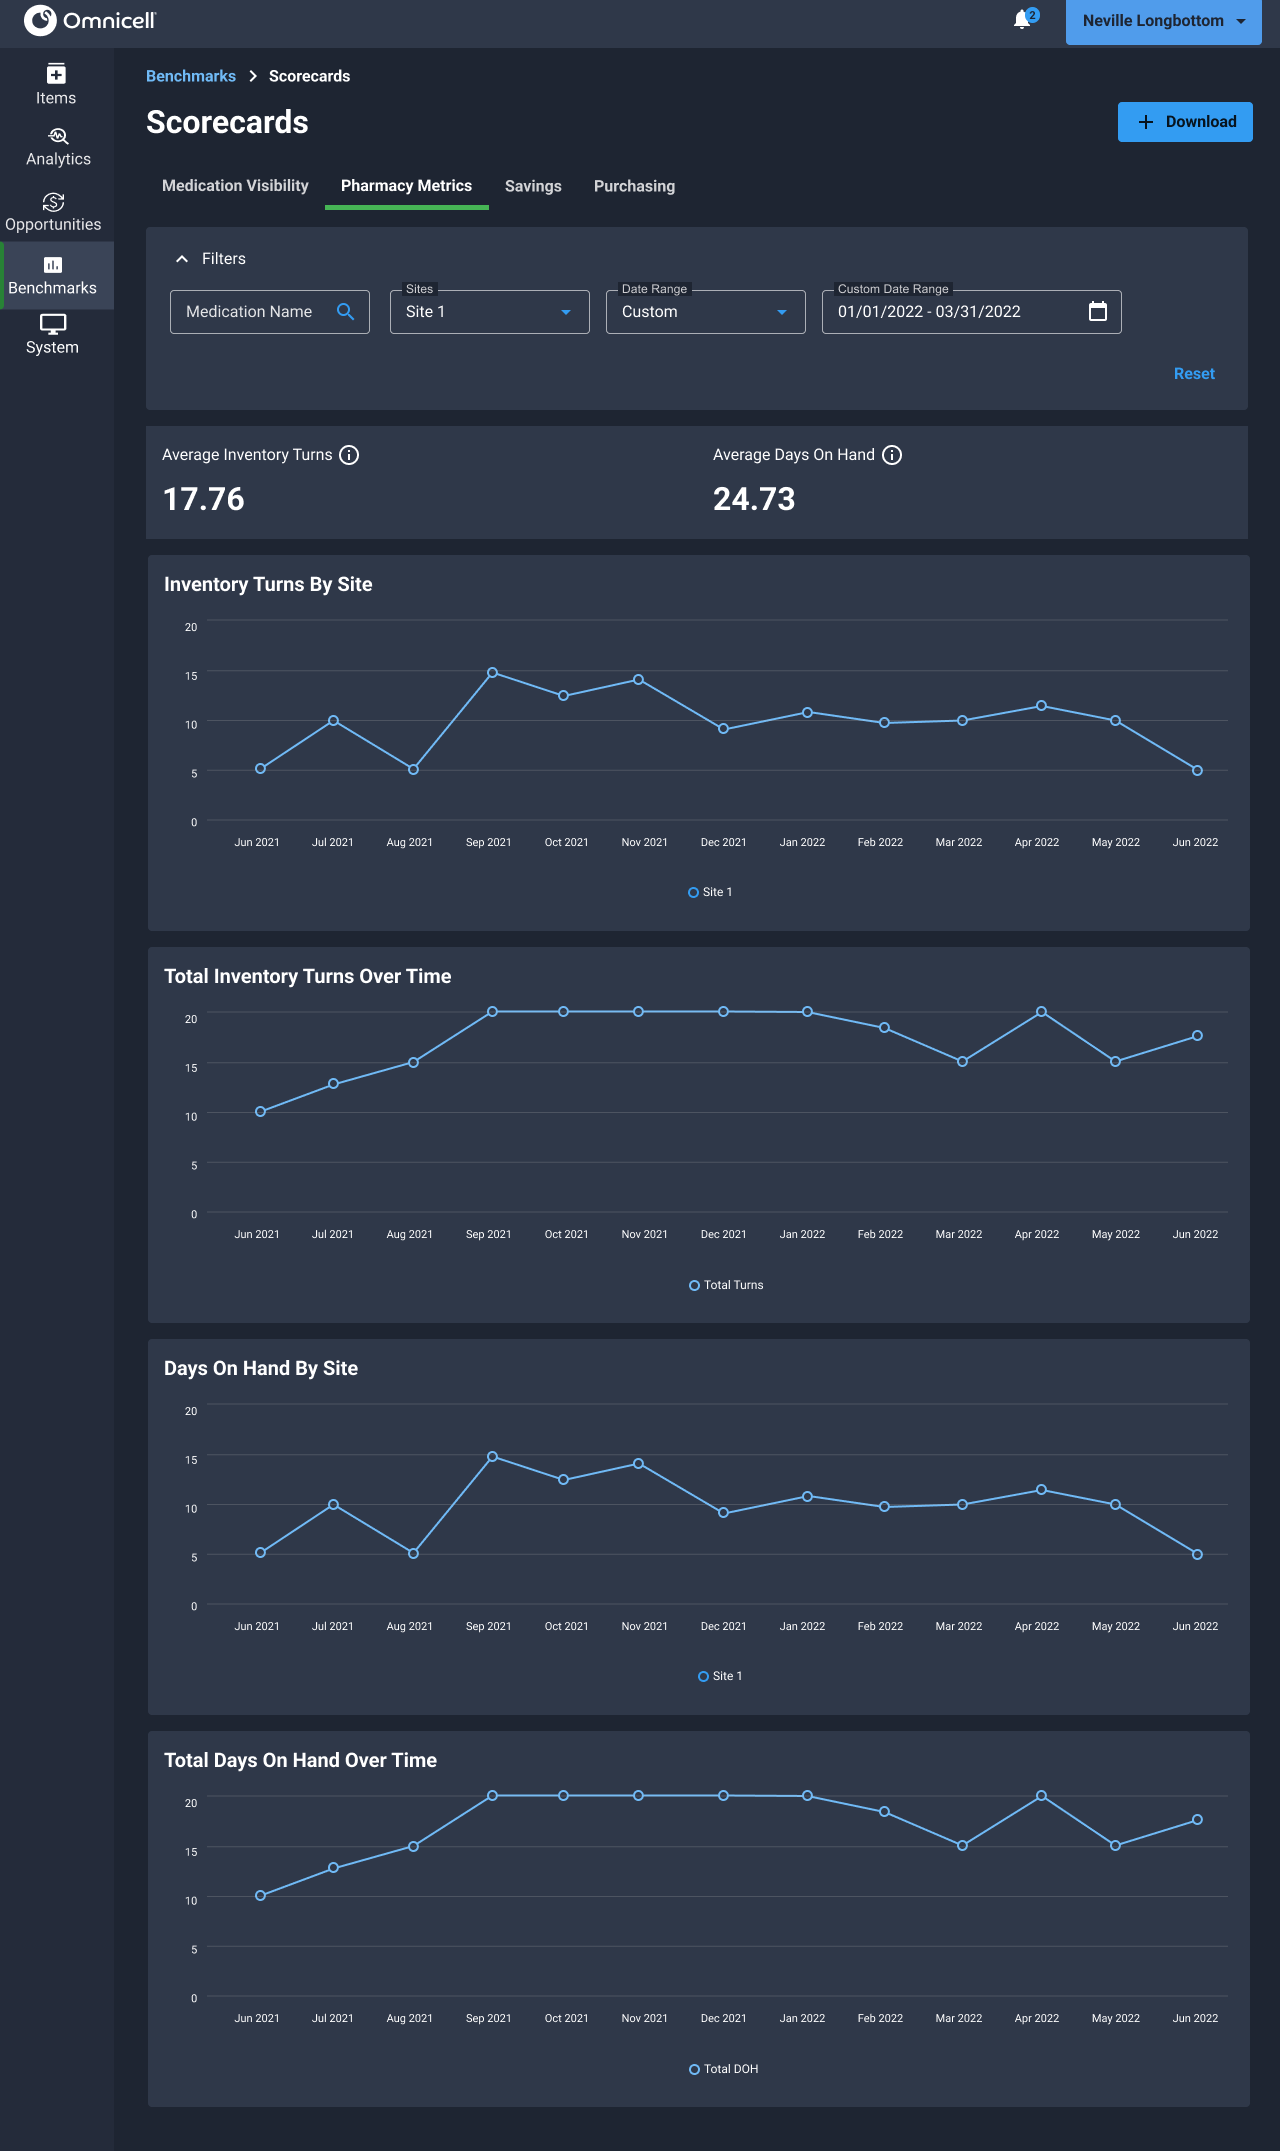
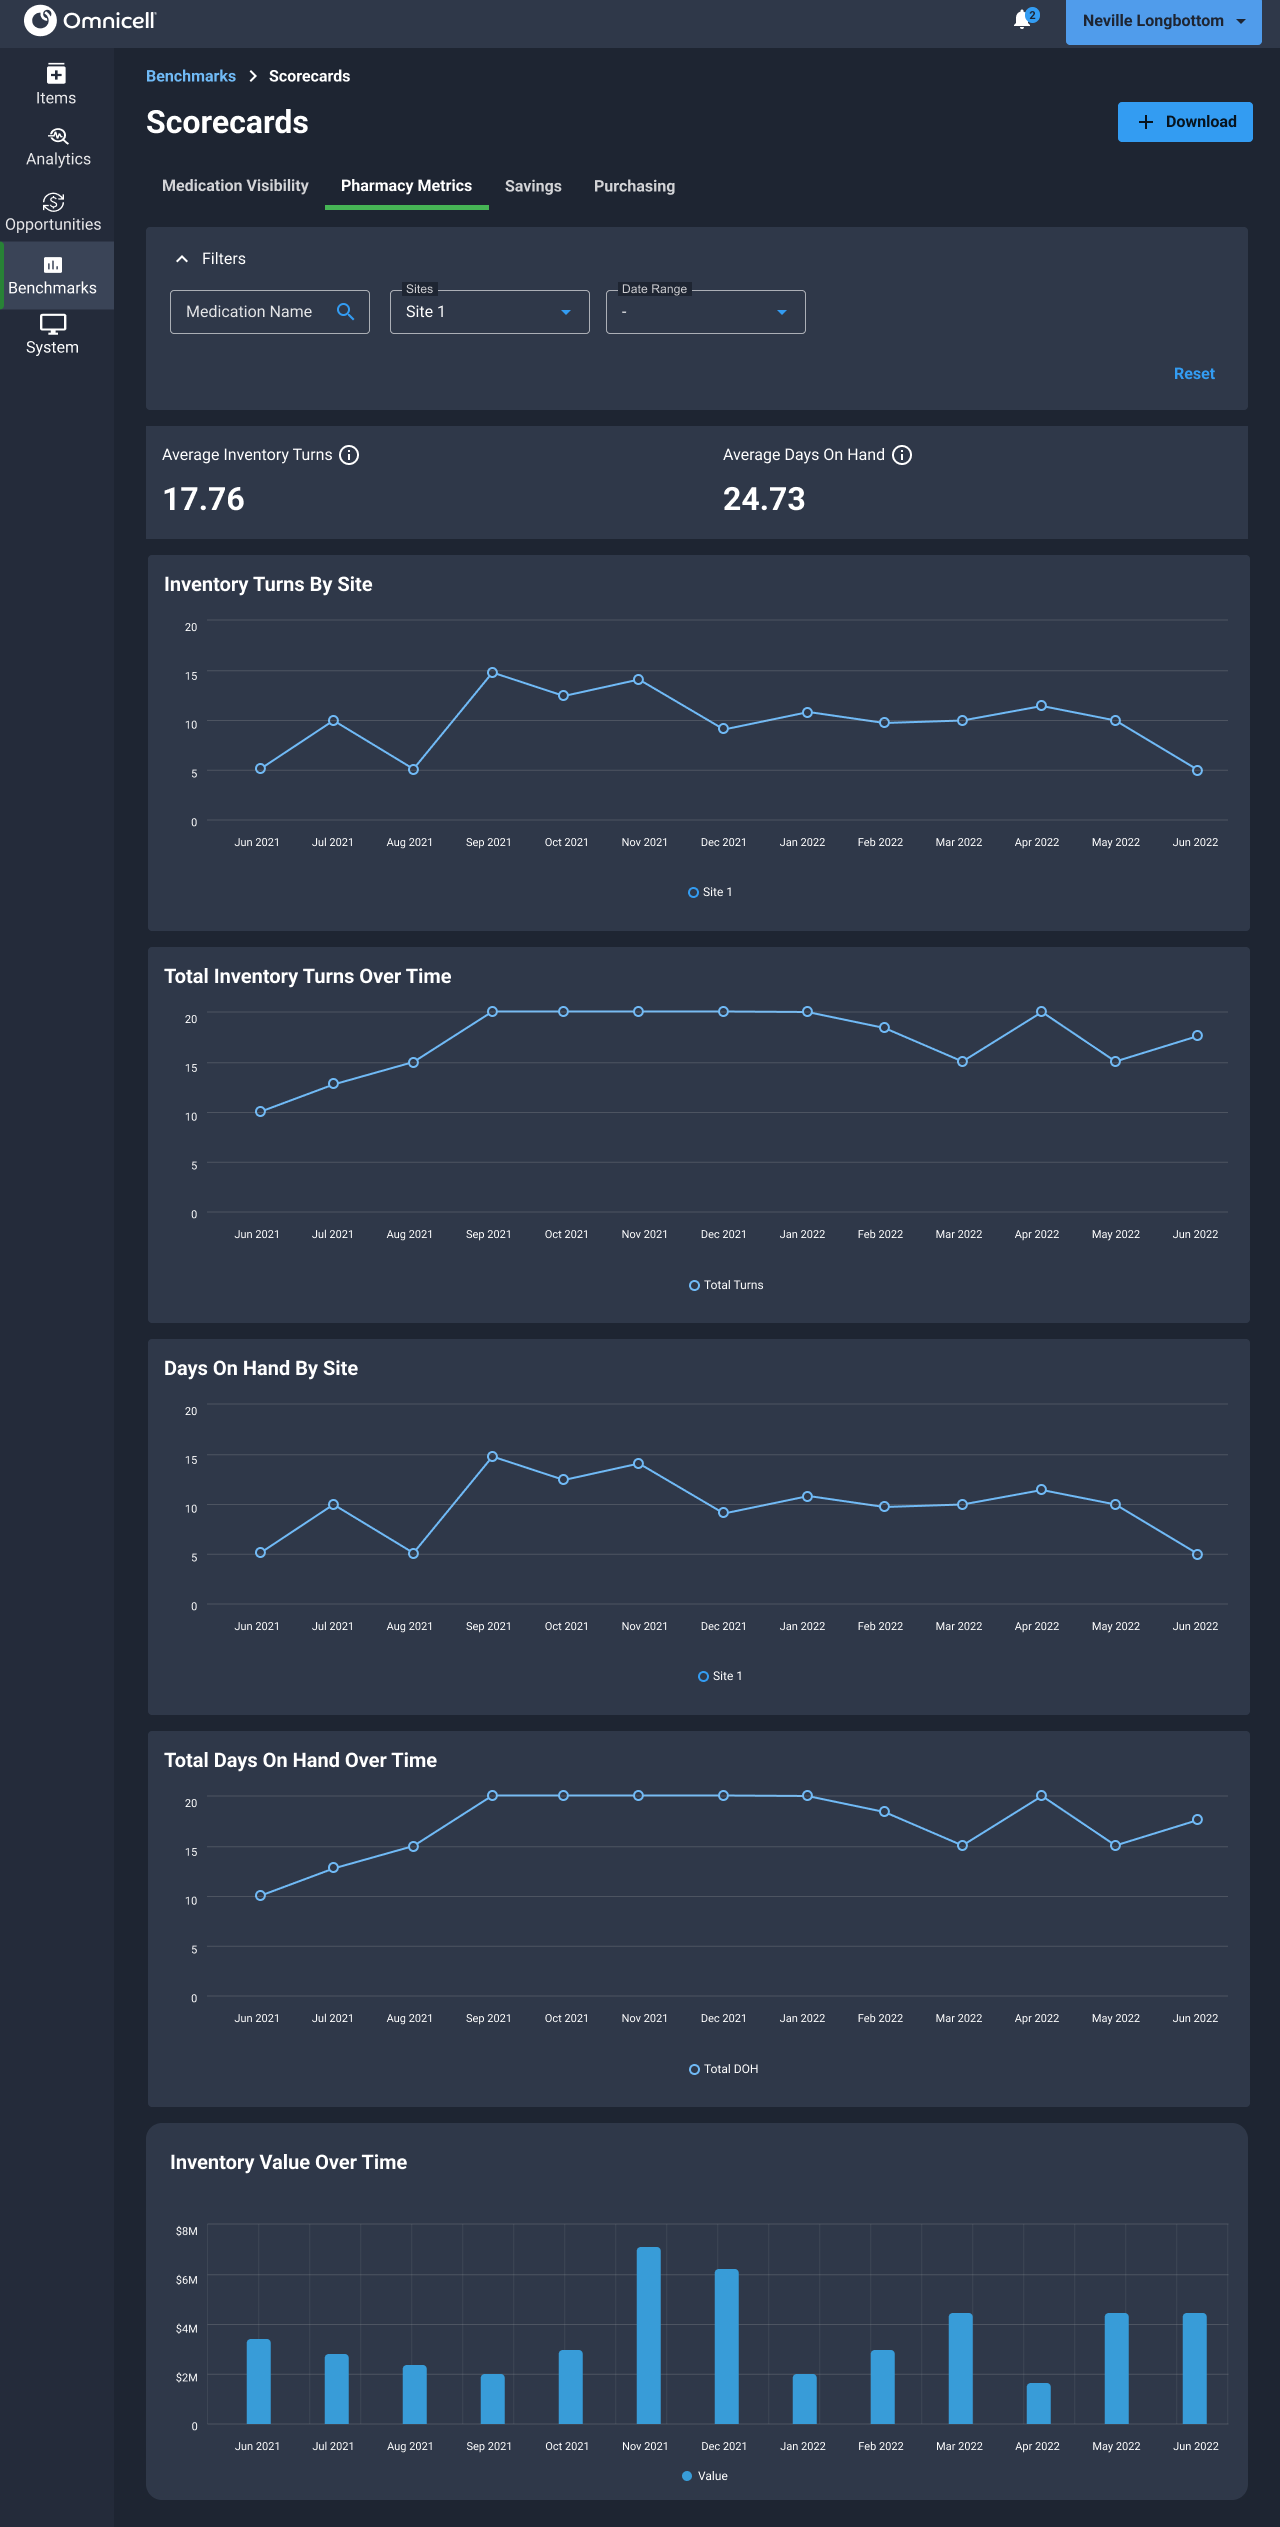
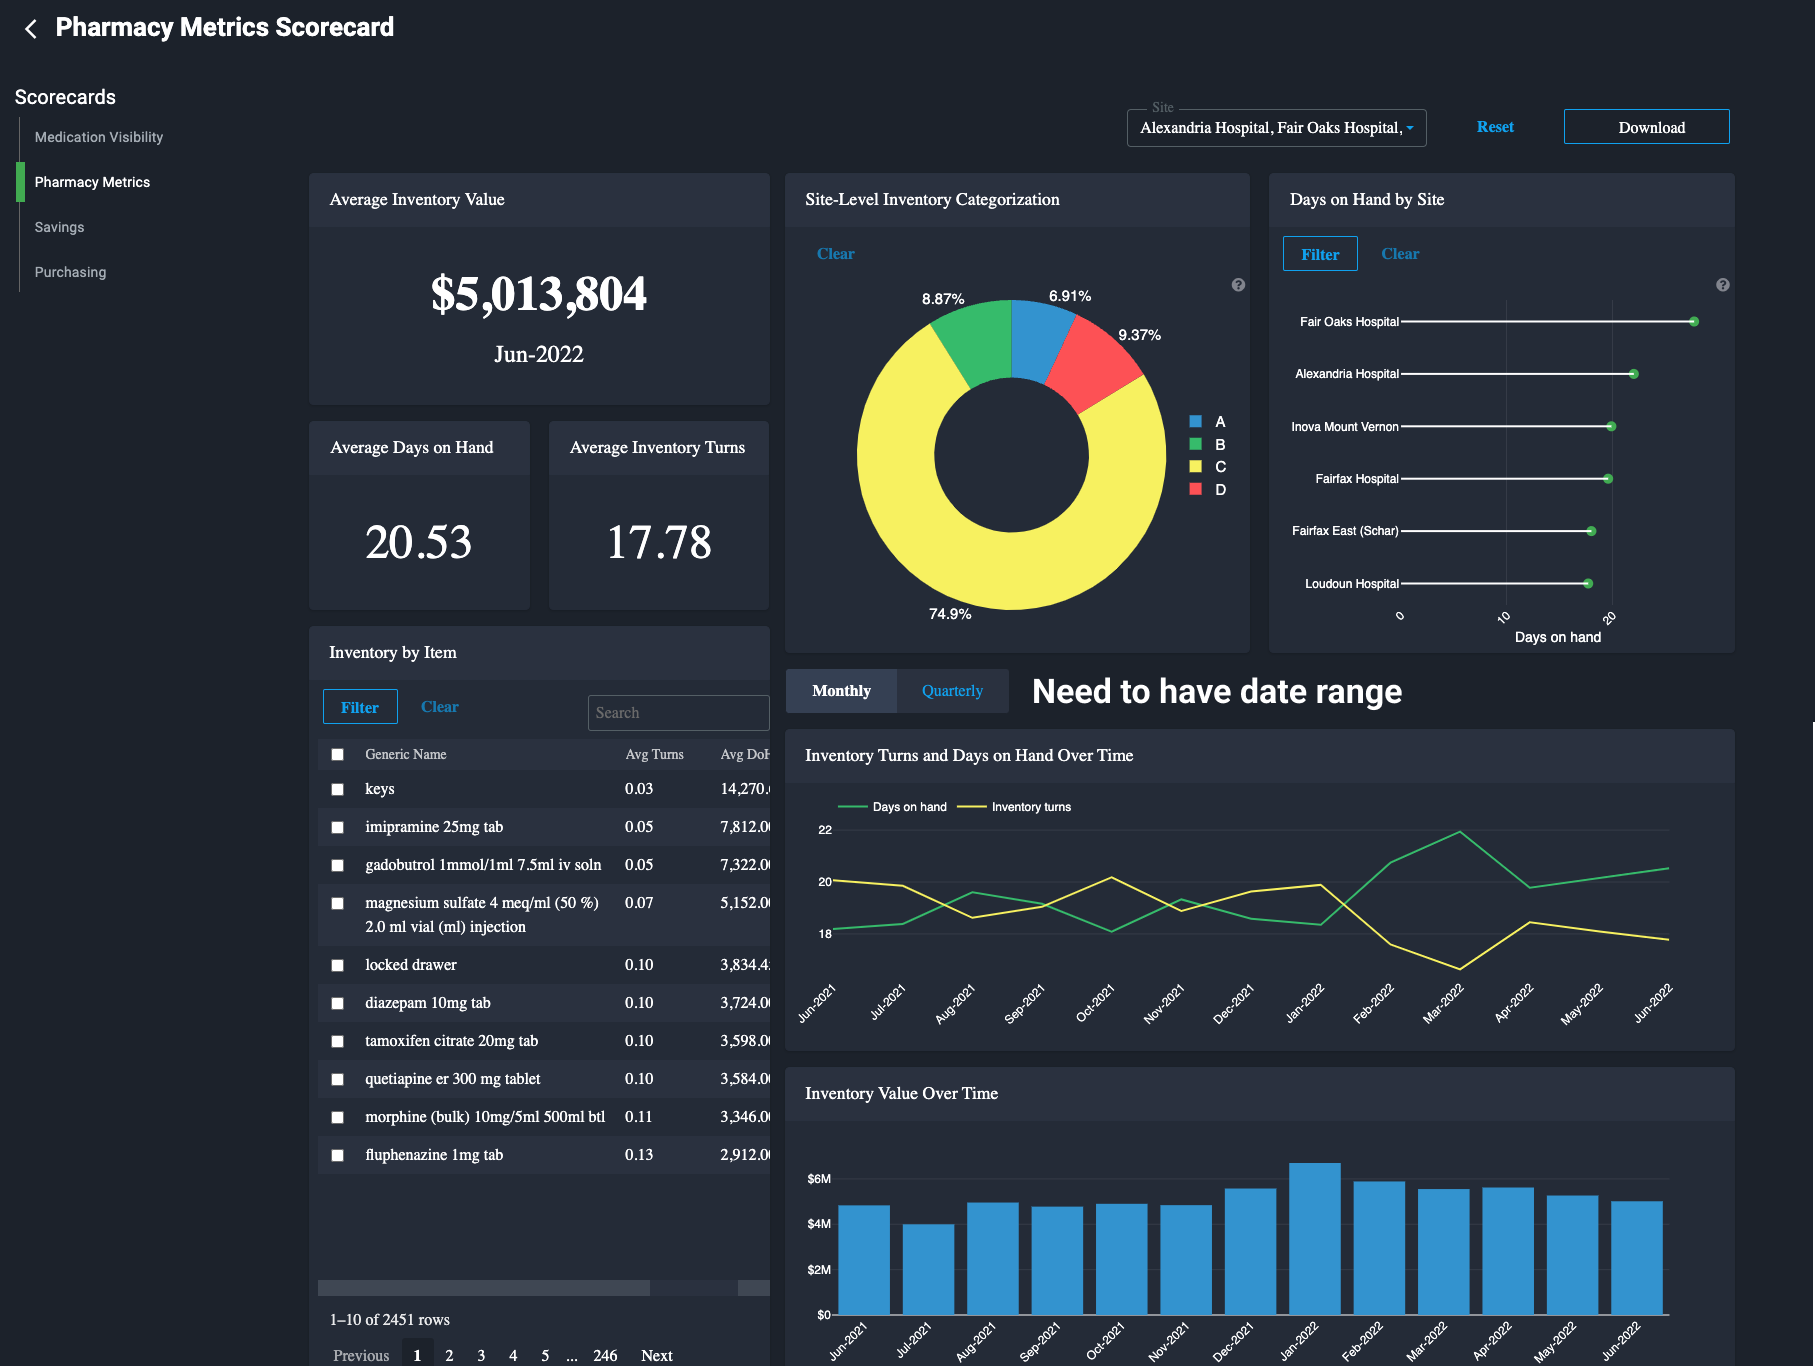
Pharmacy metrics scorecard example with dummy data.
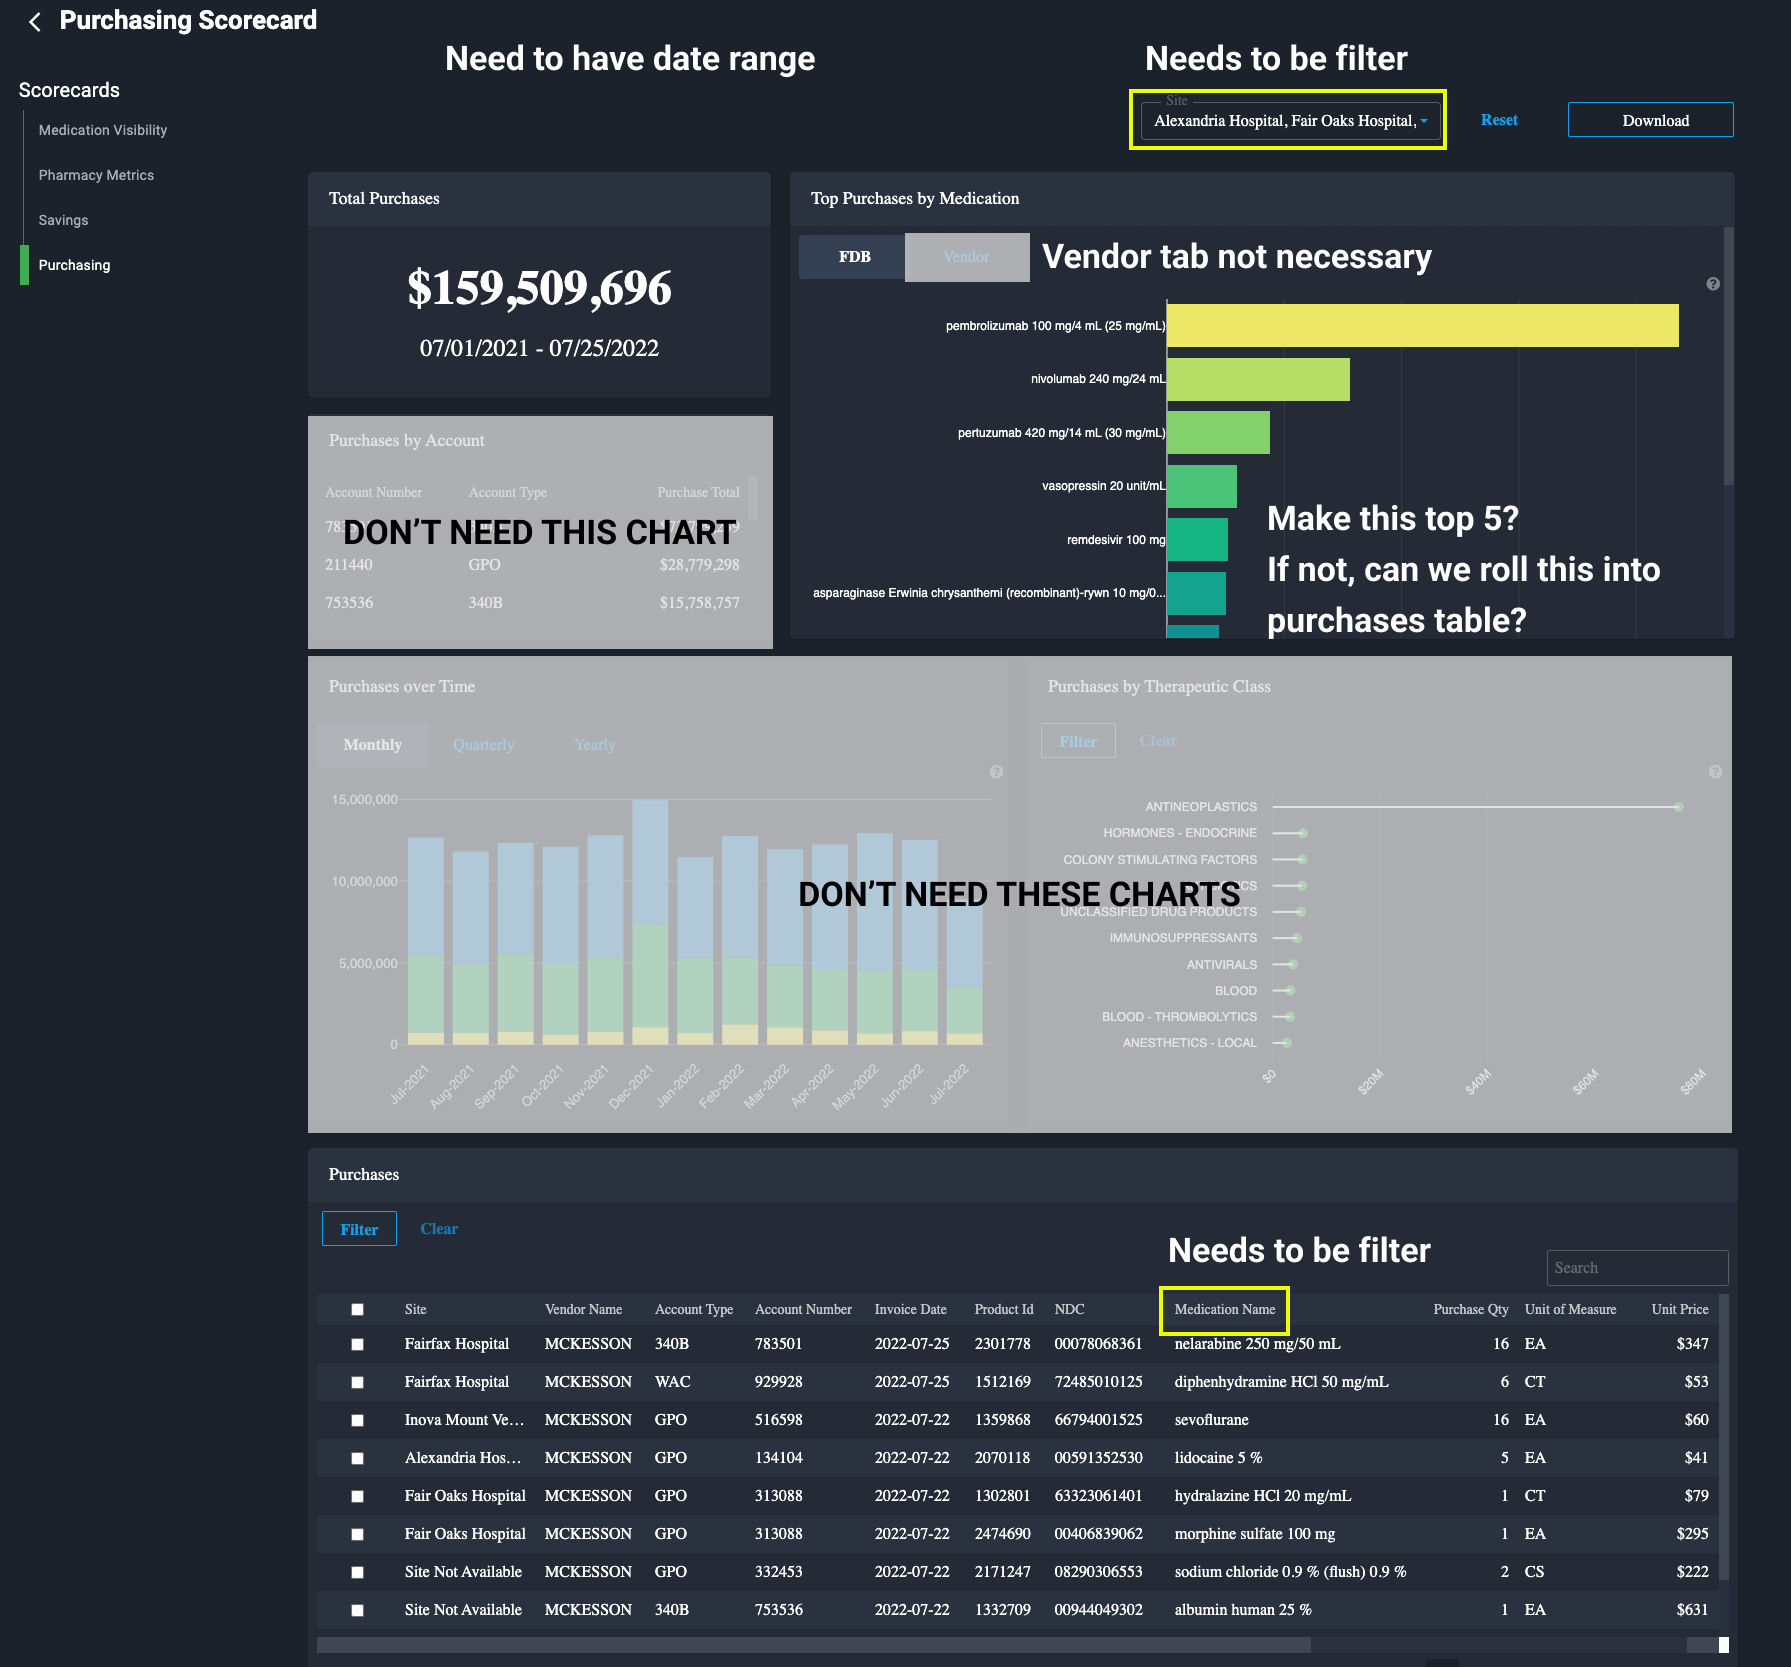
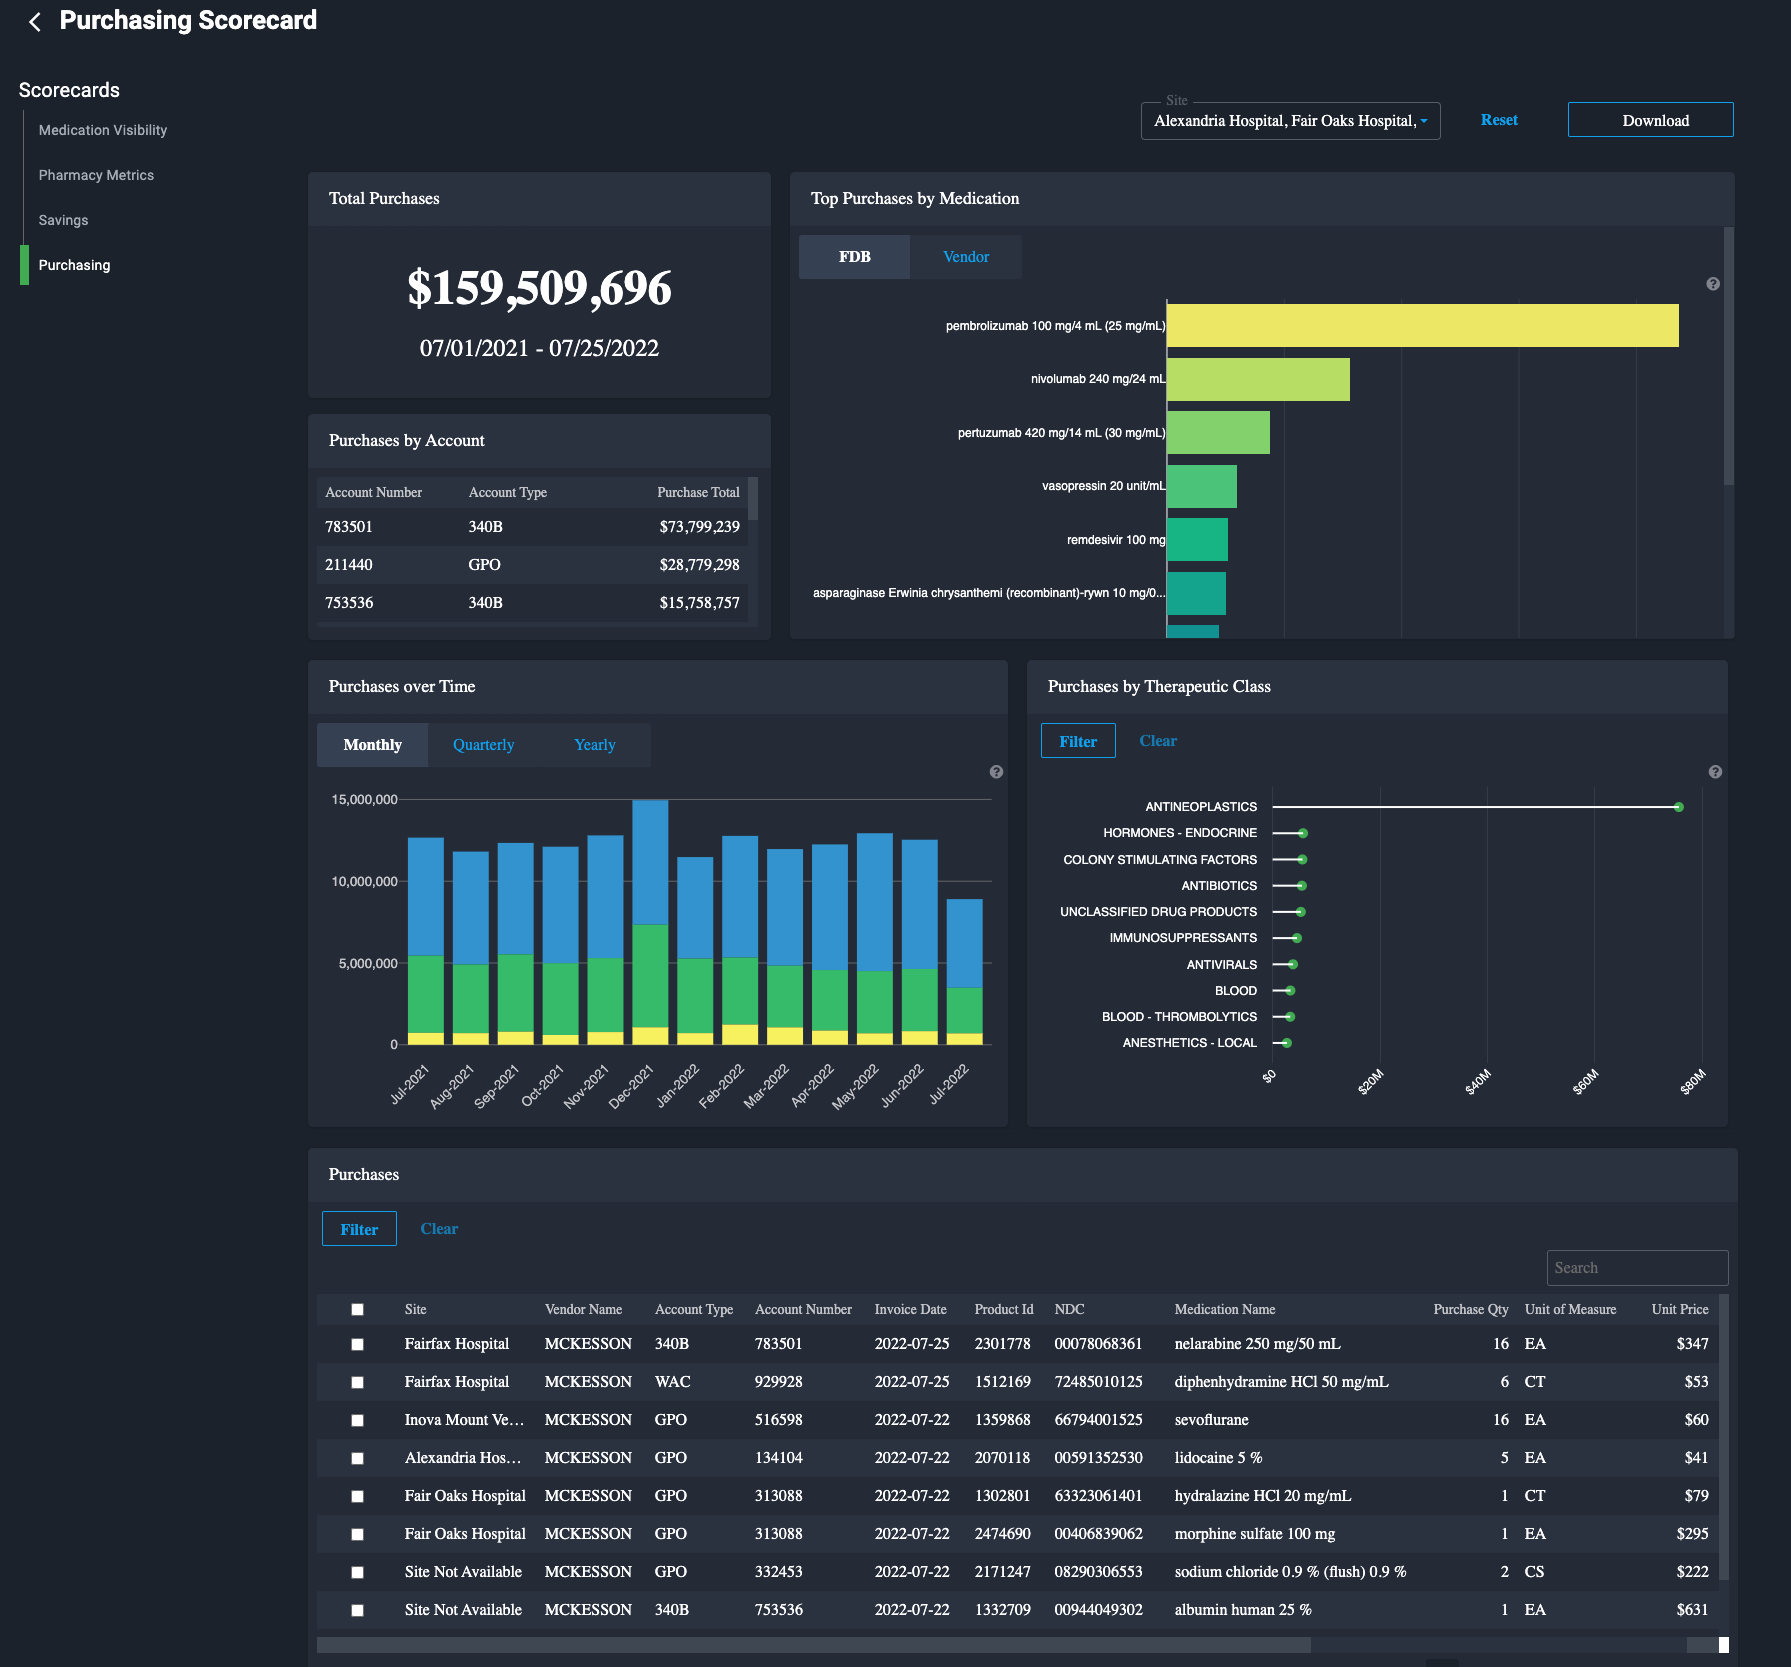
Purchasing scorecard example with dummy data.
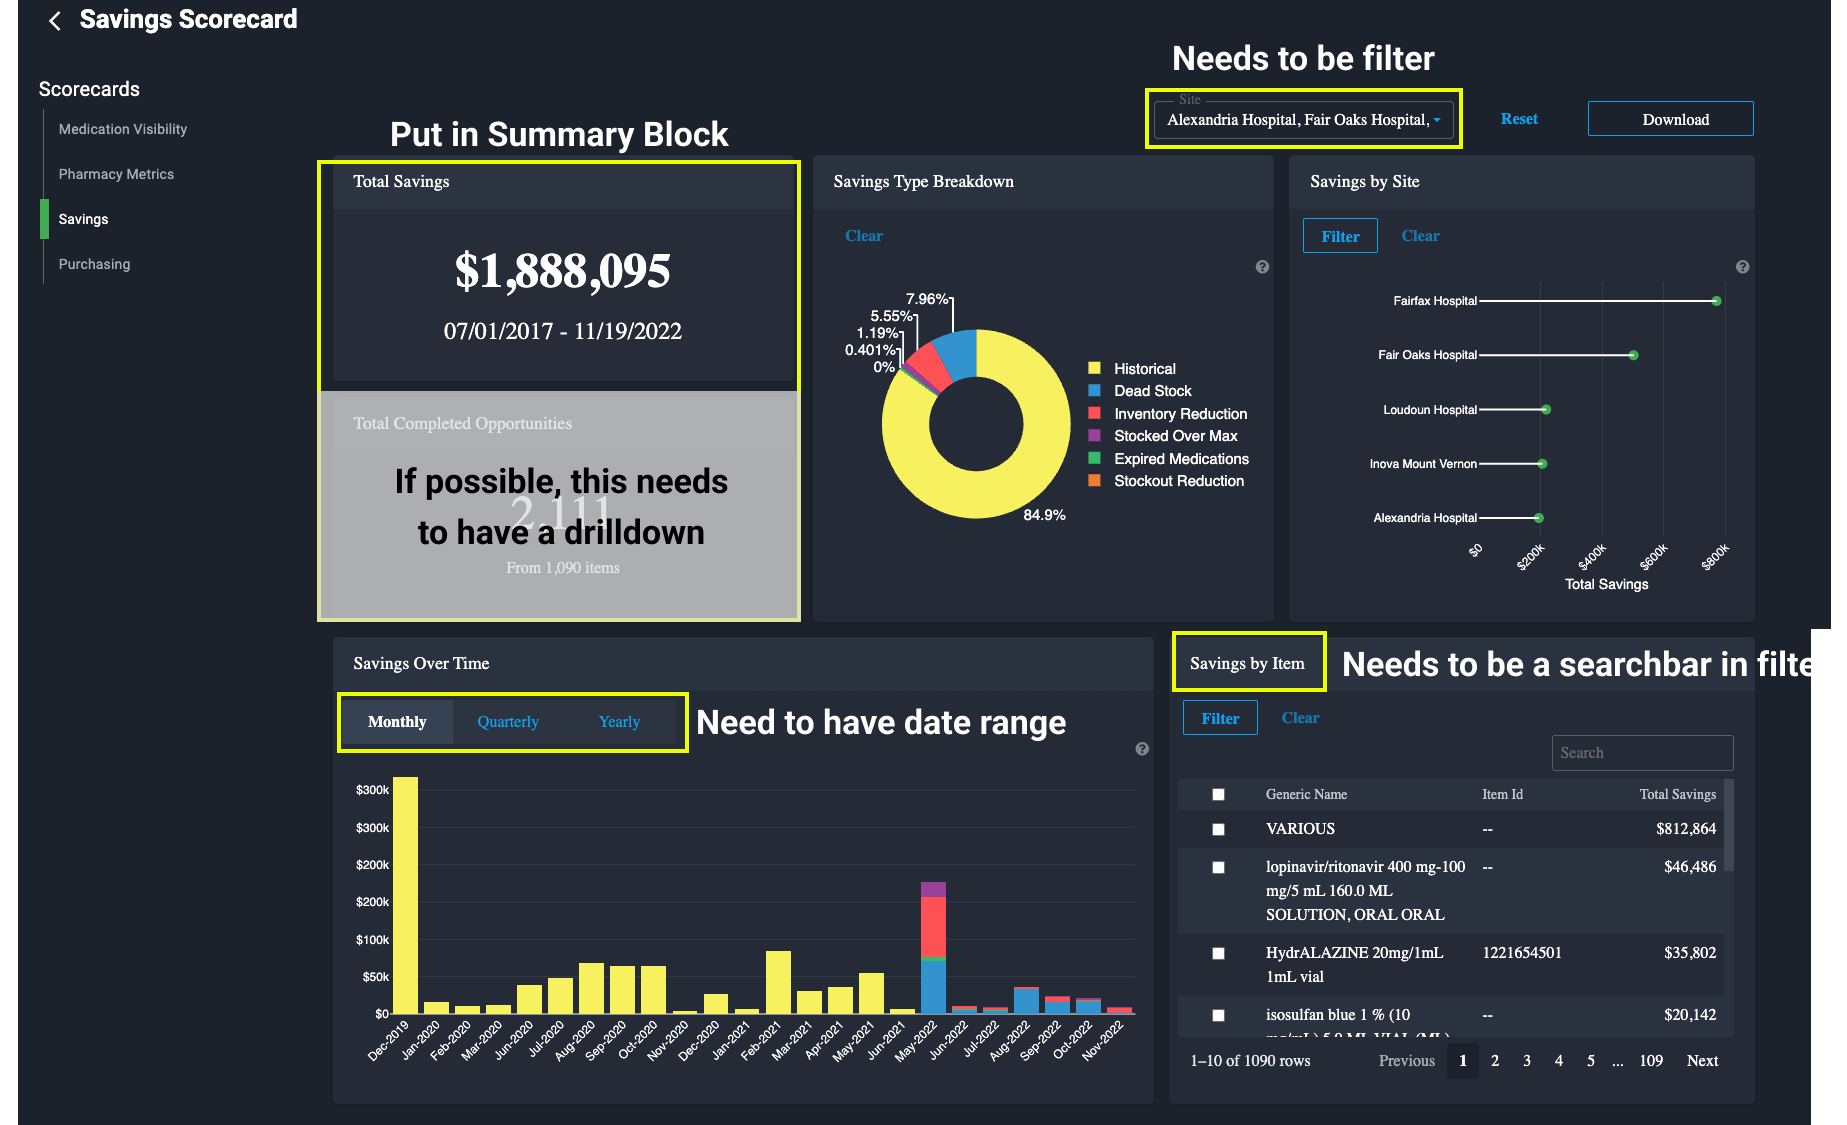
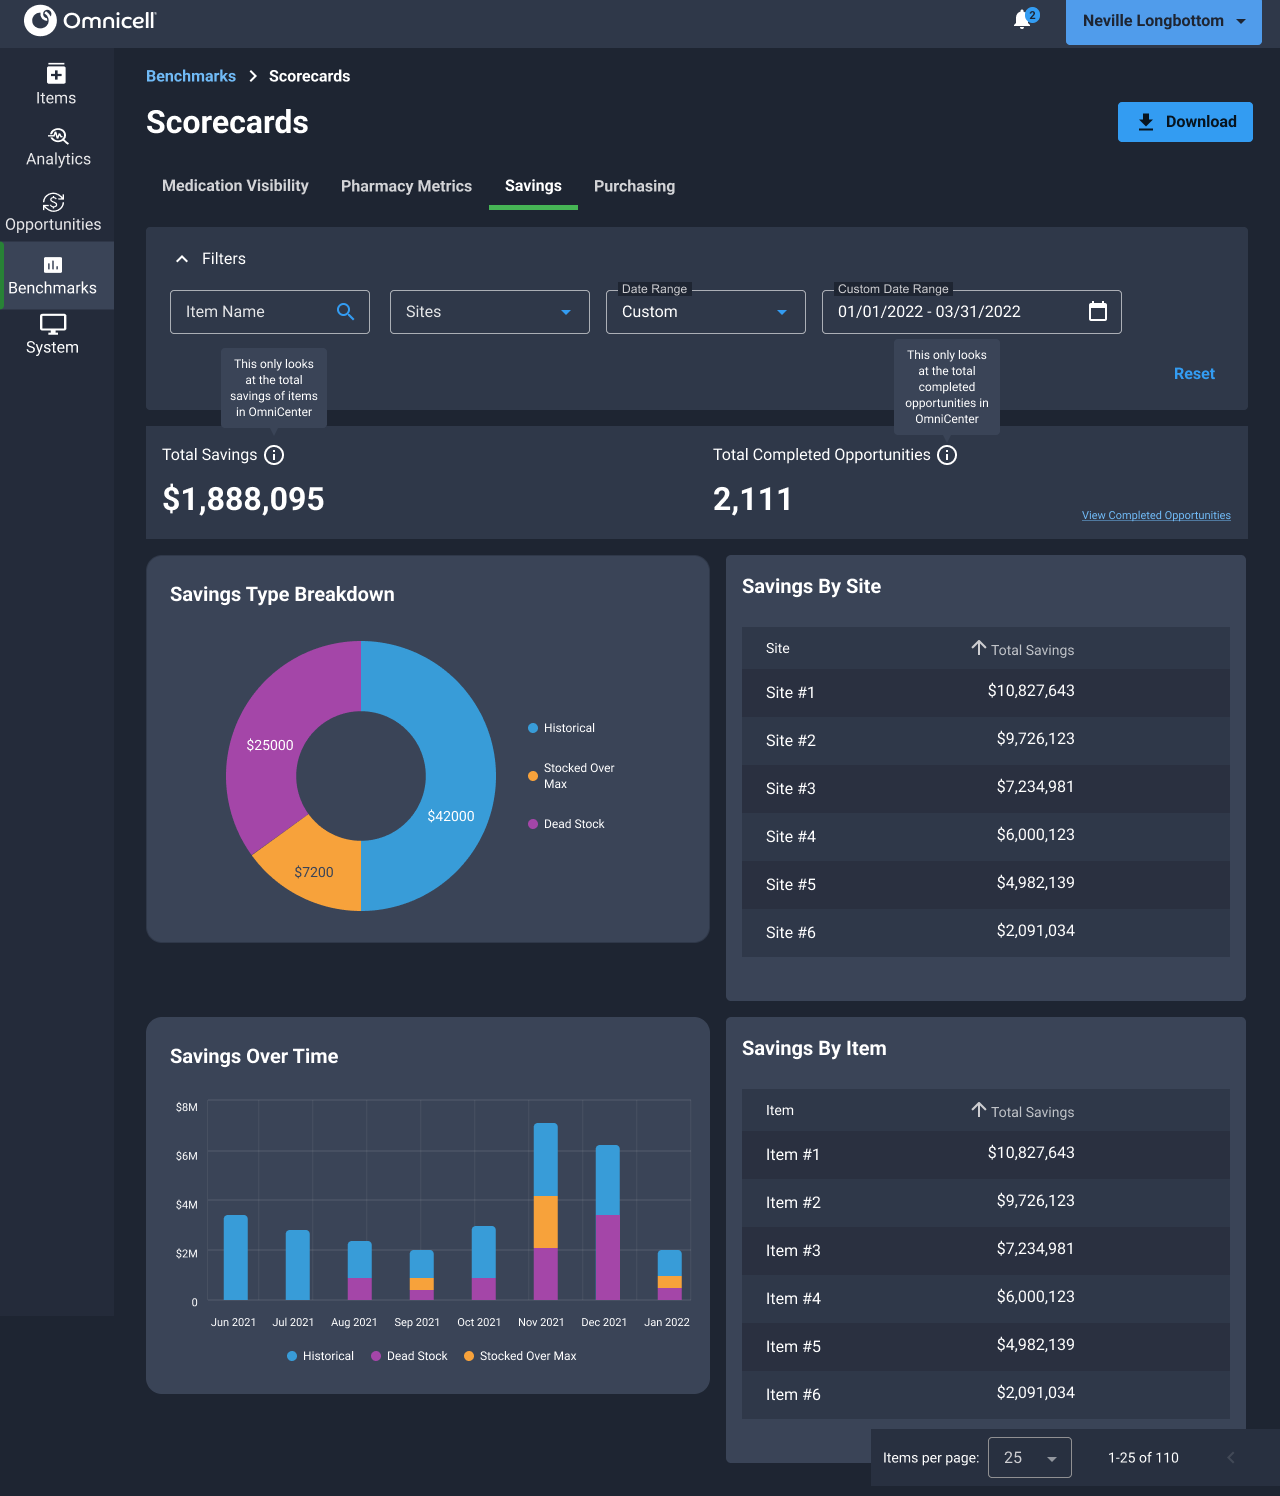
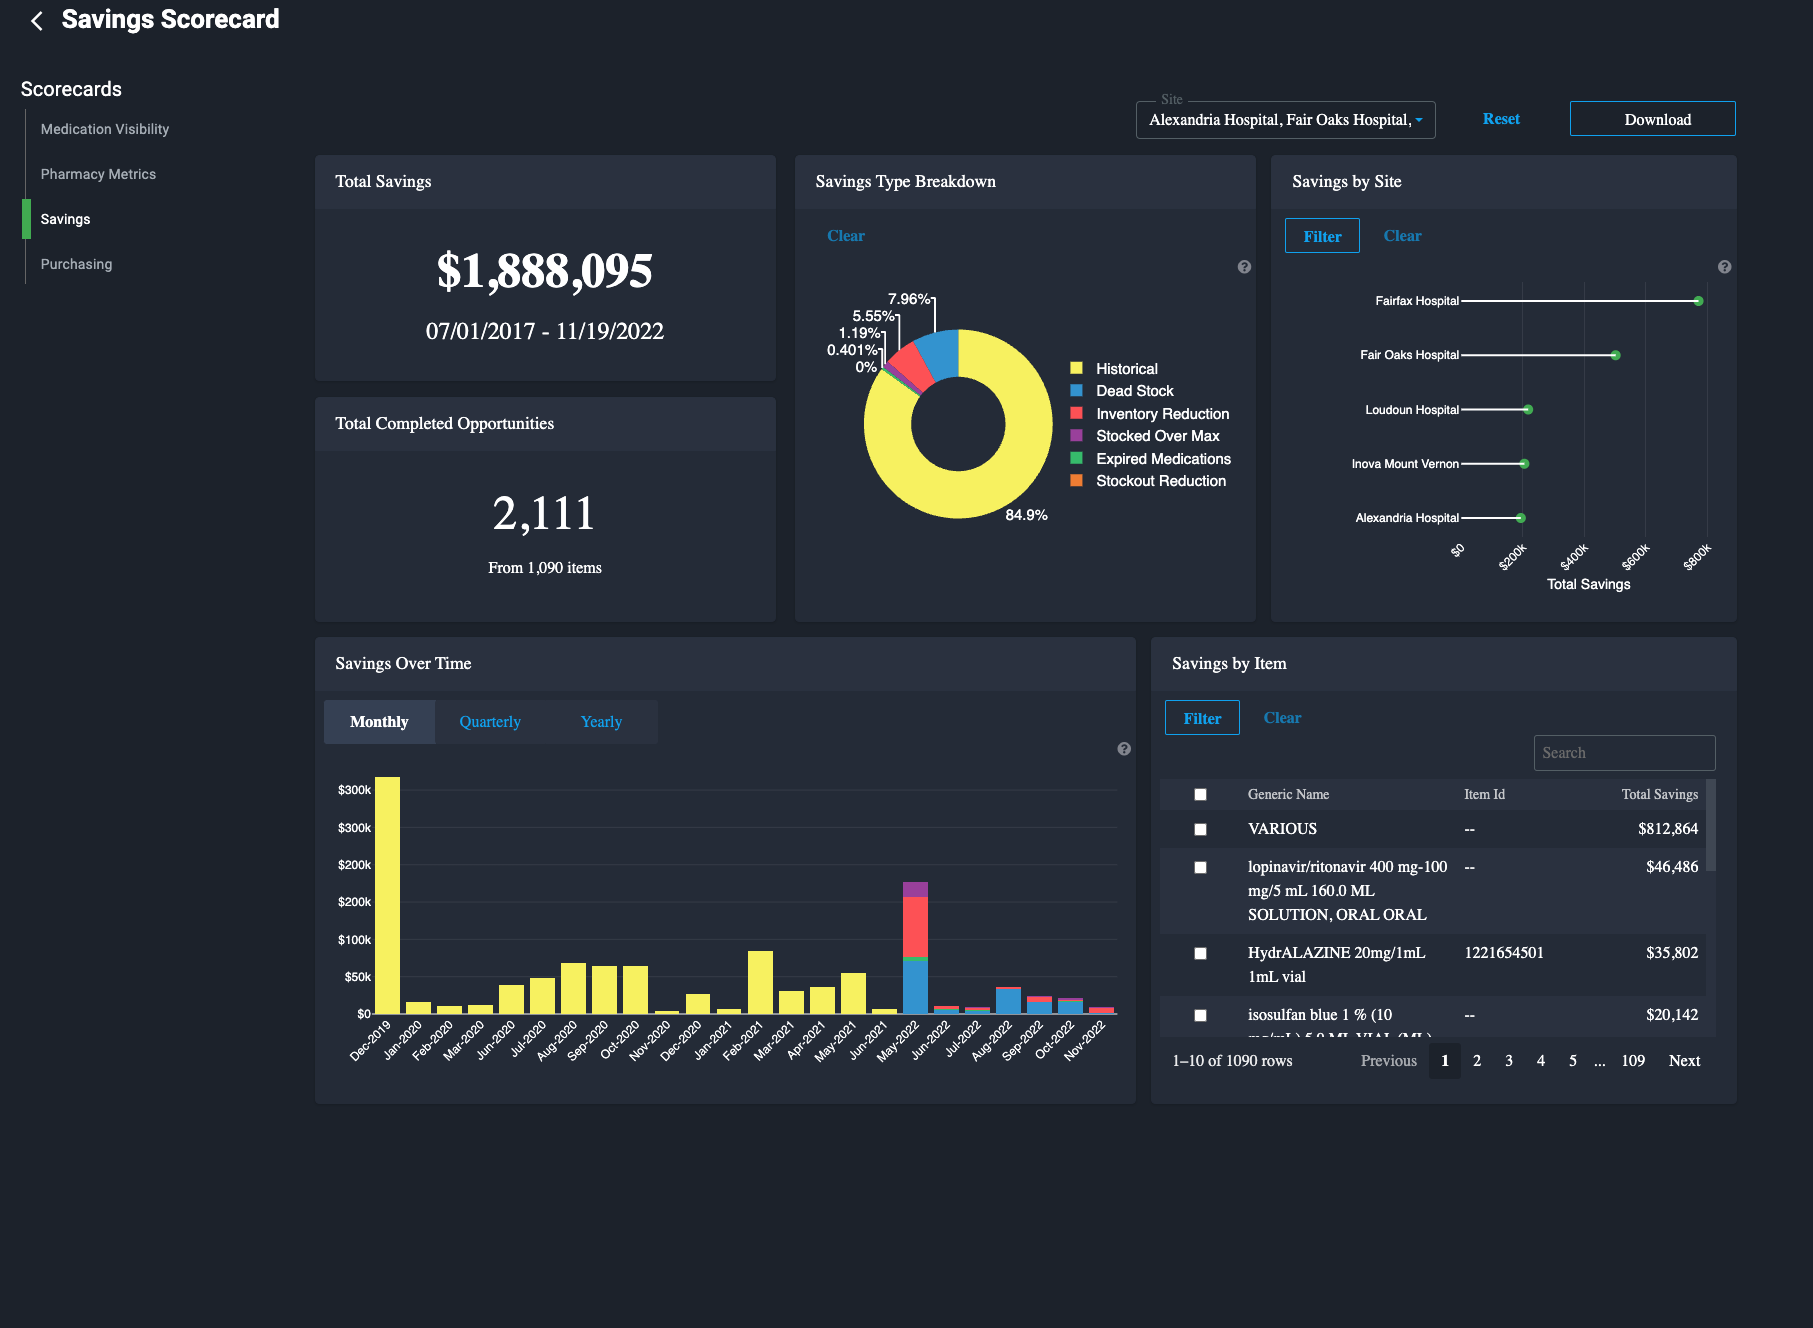
Savings scorecard example with dummy data.

Discussions with Subject Matter Experts

After performing the heuristic analysis and taking notes, I then set up time with subject matter experts to get their feedback on the existing Scorecards application. Their feedback was mostly centered around elements that we could remove, existing issues,and adding additional KPIs in the future. As we only had enough developer bandwidth to remake the screens, I made a list of items that they wanted to see in the future, and another list composed of elements we could remove and fixing existing issues. I then took screenshots of the existing pages within scorecards and began marking them up based on the heuristic analysis and the feedback from the strategists.

Medication visiblity scorecard example with notes based on heuristic evaluation and SME feedback.
Pharmacy metrics scorecard example with notes based on heuristic evaluation and SME feedback.
Purchasing scorecard example with notes based on heuristic evaluation and SME feedback.
Savings scorecard example with notes based on heuristic evaluation and SME feedback..
Savings scorecard example with notes based on heuristic evaluation and SME feedback.

Design, Feedback, Redesign

After designing the initial screens, I went through an ideation and prototyping cycle. Initial feedback was positive, however one subject matter experts felt strongly that the inventory value over time graph could be moved to the metrics page. When asked about this, other SMEs didn’t have any strong feelings one way or another, however when brought to the larger bi-weekly meeting of SMEs others agreed, so I moved it to the metrics page. There was some initial concern that there was too much information on the metrics page, however after talking with SMEs they thought that it was just enough information on the page and we could go forward with the page as I had it.

Proposed pharmacy metrics page before strategist feedback.
Proposed pharmacy metrics page after strategist feedback.

Challenges Faced

While working with the subject matter experts was fairly painless, other challenges arose in their place. The main challenge was working with a PM who felt that they had the knowledge to push back on UX decisions when they really didn’t. Multiple times I thought we had agreement on what we were going to go forward with, only to join a review and be asked if we could change the designs. This kept happening despite conversations that I had with their boss, and conversations that my boss had with both the PM and their boss. This culminated when the we (PM, engineers, and myself) all agreed that we would go forward with one idea, and the PM purposely wrote up a JIRA ticket that said we decided to go forward with her idea. After this, I told the engineers that if they had any questions over whether a JIRA ticket was right, they should come to me rather than the PM. If I had to revisit this experience, I would've gone to both my boss and the PMs boss sooner than I did in order to stop this behavior.

While the PM was the biggest issue on the product, there were also some database challenges that popped up. The largest issue was that our data wasn’t as granular across the various scorecards as we thought. For the data in Medication Visibility, we weren’t able to filter by date at all, so we had to remove the date picker. For the data in Pharmacy Metrics, we had to modify the datepicker time selections in order to match the options with the data which could only be filtered down to the month level instead of to the day.

Final Results

Overall, I'm happy with how the project turned out. While there were the dual issues of the PM and incomplete data, this was a good learning experience overall in terms of how to deal with unexpected roadblocks. The final screens can be seen below:

Final medication visiblity screen.
Final pharmacy metrics screen.
Final purchasing screen.
Final savings screen.
Omnicell Ford Credit